Forecasting Book Demand Using Statistical & Machine Learning Models
Compared ARIMA, SARIMA, XGBoost, LSTM and hybrid forecasting models across two book sales datasets to evaluate forecasting accuracy and business value.
Auto ARIMA Forecast
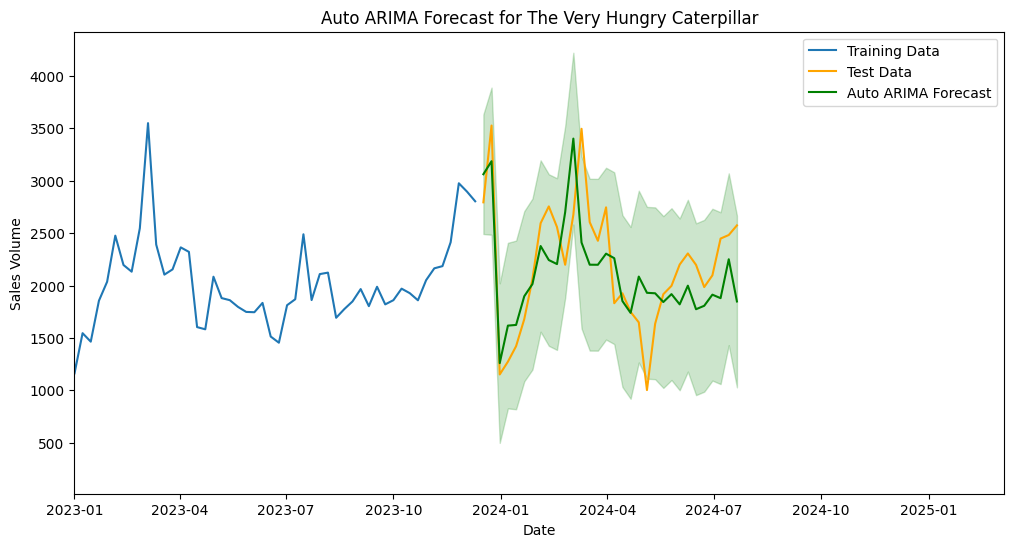
Two datasets. Seven model approaches. One forecasting workflow.
The project investigated whether historical sales data could forecast future book demand accurately enough to support procurement, stock planning and inventory decisions.
Why demand forecasting matters
Book sales are affected by trend, seasonality, popularity cycles and sudden demand spikes. For publishers and retailers, poor forecasting can create stock shortages, excess inventory and inefficient procurement decisions.
This project used historical sales data for The Very Hungry Caterpillar and The Alchemist to test whether future demand could be predicted using a mix of classical statistical models and machine learning techniques.
The goal was not simply to build a model, but to compare approaches objectively and identify which method produced the most useful forecasts for each dataset.
Can historical sales patterns support better planning decisions?
The analysis focused on trend, seasonality, forecast accuracy and residual behaviour to understand whether model outputs were reliable enough to inform business decision-making.
Trend and seasonality were visible in the sales series
Decomposition helped separate the observed sales volume into trend, seasonal and residual components, making it easier to understand the underlying structure before modelling.
Time Series Decomposition
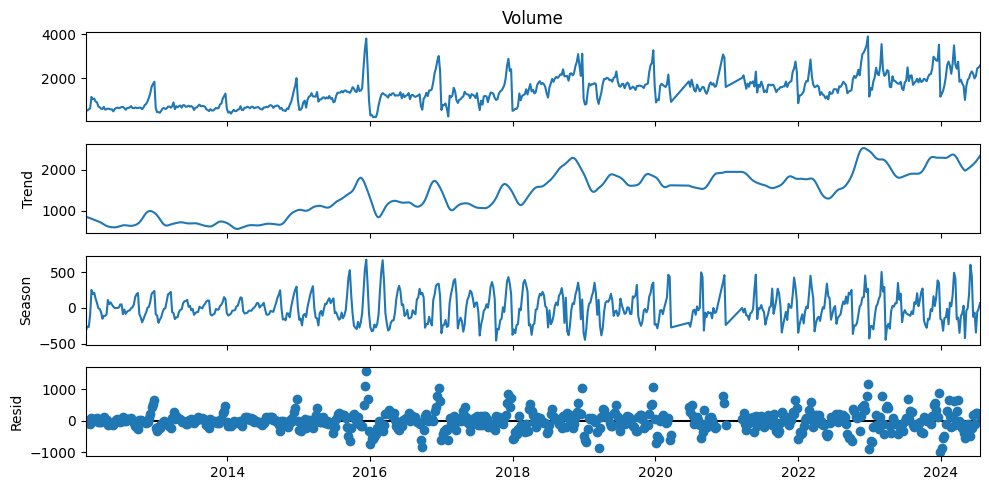
Trend
Sales showed a long-term upward movement, suggesting the series was not purely random.
Seasonality
Recurring fluctuations indicated that repeating demand patterns were present in the data.
Residuals
Remaining noise highlighted the limits of modelling and the need for forecast diagnostics.
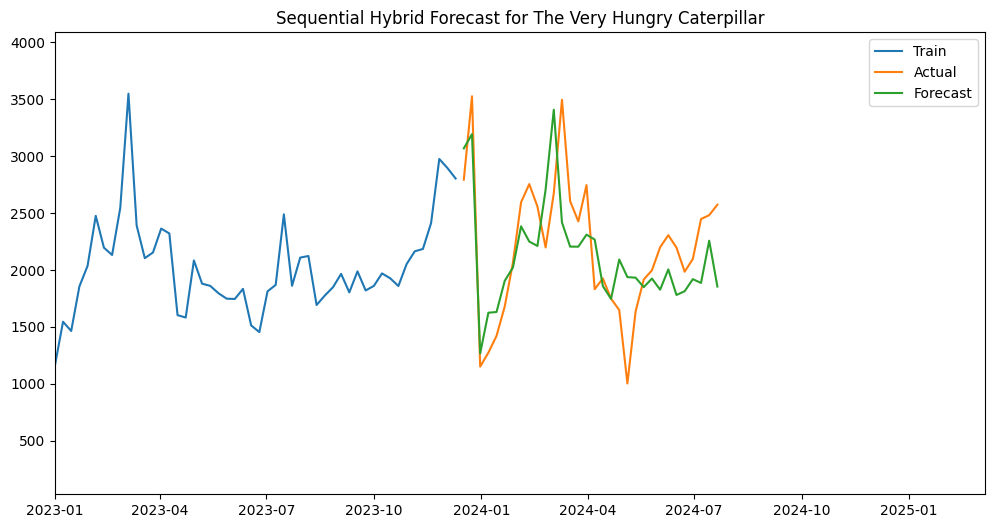
The Very Hungry Caterpillar
This dataset contained larger sales volumes, visible seasonality and recurring demand movement. Statistical forecasting approaches performed particularly well, with the strongest monthly result achieved by SARIMA.
Sequential Hybrid Forecast
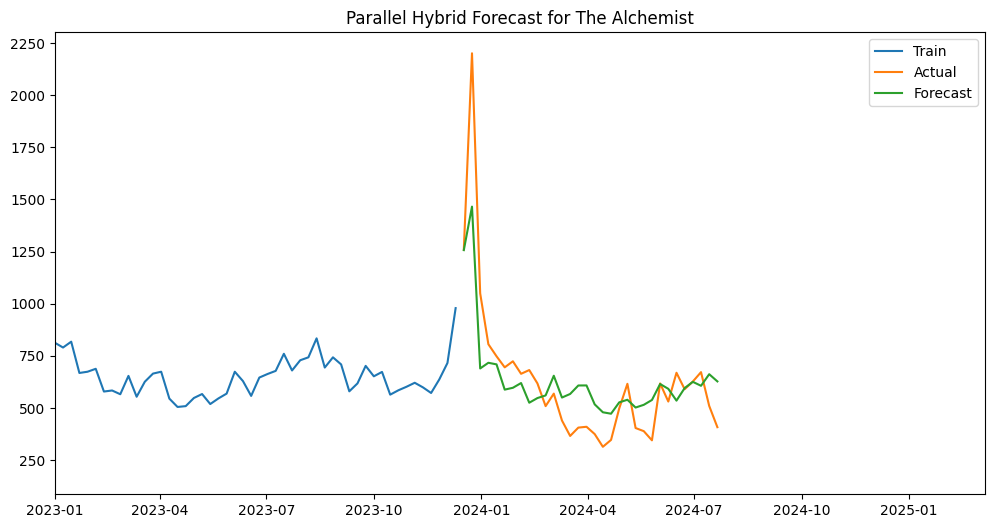
The Alchemist
The Alchemist behaved differently, with a sharp demand spike followed by lower, more stable sales. The best result came from a parallel hybrid approach, showing that different datasets can favour different forecasting methods.
Parallel Hybrid Forecast
Model performance varied by dataset
The results showed that no single model consistently dominated. The best approach depended on the structure and behaviour of the individual sales series.
| Model | Caterpillar MAPE | Alchemist MAPE | Comment |
|---|---|---|---|
| Auto ARIMA Weekly | 17.17% | 25.79% | Strong statistical baseline |
| XGBoost Weekly | 26.89% | 34.93% | Lag-based ML approach underperformed here |
| LSTM Weekly | 23.85% | 27.15% | Deep learning did not outperform simpler models |
| Sequential Hybrid Weekly | 17.13% | 25.80% | Competitive hybrid performance |
| Parallel Hybrid Weekly | 17.07% | 23.31% | Best weekly result for both books |
| SARIMA Monthly | 16.21% | 35.96% | Best overall result for Caterpillar |
| XGBoost Monthly | 16.74% | 40.42% | Strong for Caterpillar, weak for Alchemist |
End-to-end forecasting workflow
The project followed a structured analytical process, moving from exploration and diagnostics through to model development and evaluation.
What the project demonstrated
Model choice matters
Different datasets favoured different forecasting approaches, so model selection needed to be evidence-led.
Simpler models stayed competitive
Classical statistical methods performed strongly and, in some cases, outperformed more complex ML models.
Forecasts need business context
Accuracy metrics are useful, but the real value comes from supporting procurement and inventory decisions.
Technologies used
Explore the full project
The full repository contains the supporting notebooks, preprocessing steps, model outputs and evaluation work.